This is Episode 1B of The Observability Cost Crisis. If you haven’t read Episode 1A, start there — it sets up everything that follows.
Seven in the Evening
The office floor had gone quiet.
Most of the team had left by six. The cleaning staff made their rounds, nodding politely at the desks still occupied. Asep noticed, without much feeling about it, that the office boy had started leaving a fresh trash bag near his workstation before heading home — a small, wordless acknowledgment that late nights here had become routine.
Fajar was still at his desk, working through service configuration data with the focused patience of someone who understood that this problem had existed before him and was therefore, in some sense, partly his to untangle. Dita was still there too, cross-referencing sources against query histories, her notebook steadily filling.
At seven-fifteen, Dito appeared.
He set three cups of coffee on the desk with the quiet ceremony of someone delivering something they are proud of. The cups were, against reasonable expectation, still hot.
“There was a place two blocks down that kept the thermos going,” he said, by way of explanation. He produced a paper bag from under his arm. Pisang goreng, also still warm.
“How’s your mother?” Asep asked.
“Doing well. She said thank you for the dragon fruit.” He paused. “She also said, and I quote, ‘Tell your boss he has good manners.’”
Fajar smiled. Dita looked up from her notebook and laughed. Even Asep allowed himself a brief, tired version of a smile.
“Glad to hear it,” Asep said. “Now sit down. We still have work.”
Dito sat down with the air of a man fully at peace with this outcome.
The Wrong Kind of Searching
Asep had been staring at the same section of data for two hours.
He knew this kind of problem. He had seen it in different companies, different stacks, different decades. The shape of it was familiar: costs rising without a clear single cause, the source diffuse rather than singular, the answer somewhere in the accumulated decisions of recent months.
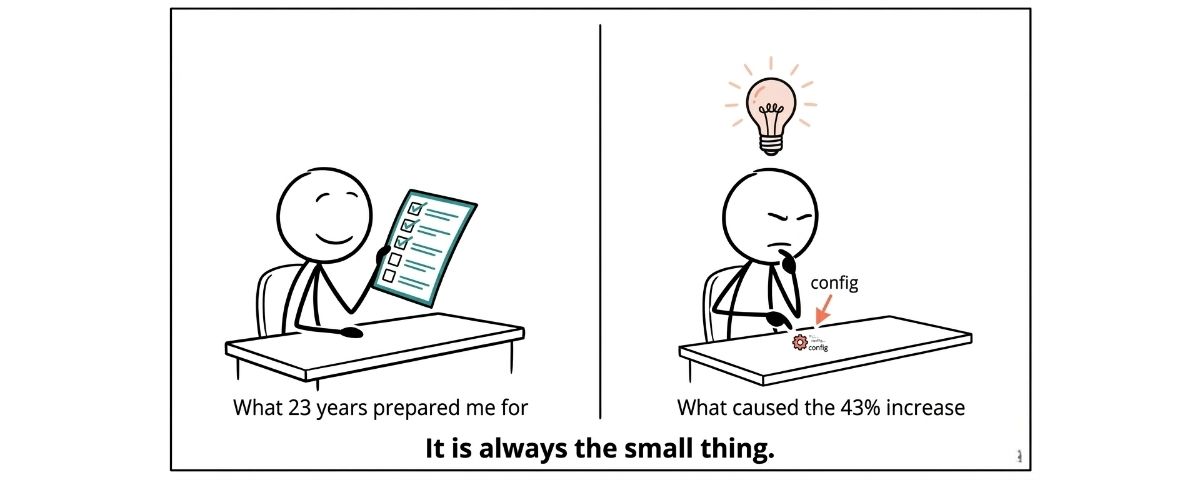
He kept looking for the big thing. The obvious misconfiguration. The integration someone had set up carelessly. Something that, once identified, would account for the whole 43% and give him a clean explanation for the director.
He kept finding smaller things instead. An inactive source here. A retention policy set too long there. Each one real, each one worth fixing — but none of them felt like enough.
Fajar leaned back from his screen.
“I keep coming back to the Kubernetes cluster,” he said. “I’ve been looking at the log volume, and I think we’re asking the wrong question. The question isn’t whether the volume looks normal for the service count. The question is why it’s generating that volume.”
Asep looked at him. It was a precise and useful observation — the kind that came from someone who was still fresh enough to question assumptions the rest of them had stopped noticing.
“Good thinking,” Asep said. “That’s the right question. Start there.”
Fajar nodded and turned back to his screen.
Thirty Days
While Fajar dug into the cluster, Dita had been doing something different: looking at the platform’s own internal metrics and index activity — data that the observability system generated about itself.
“I found something,” she said. “But I’m not sure how to read it.”
Asep rolled his chair over.
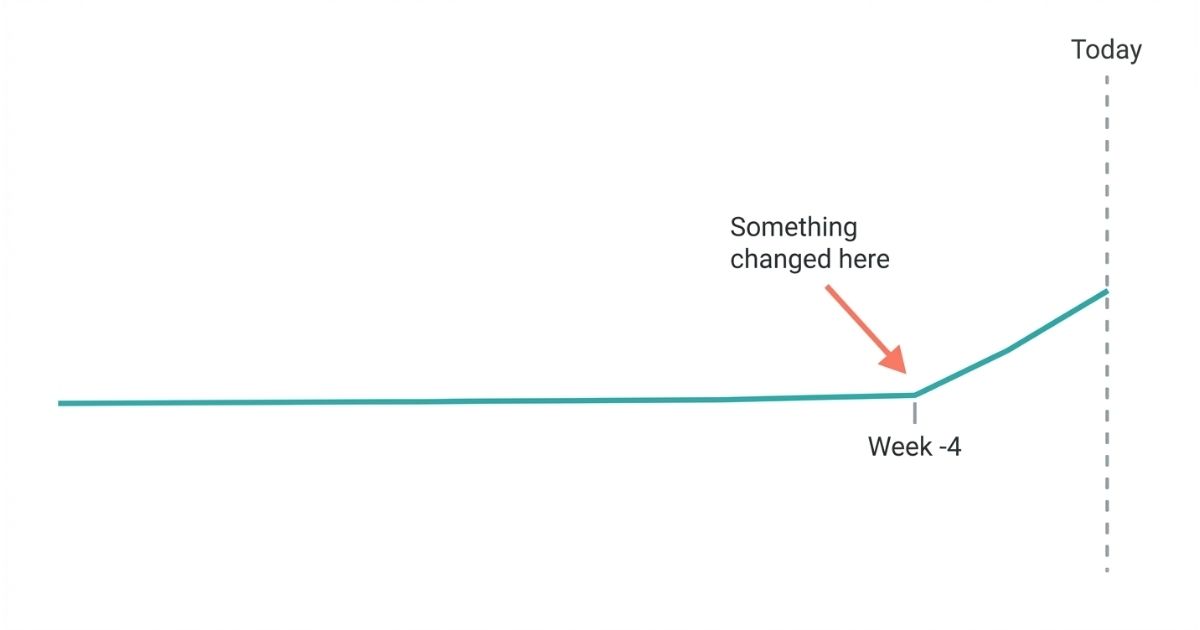
On her screen was a metrics chart showing ingestion volume over time — specifically for the Kubernetes cluster. For most of the visible window, the line was flat and steady. Then, roughly four weeks ago, it had climbed. Not dramatically, not all at once — but consistently, incrementally, like something that had been turned up and never turned back down.
“Our internal metrics retention is 30 days,” Dita said. “If this had happened five weeks ago, we wouldn’t even be able to see it right now.”
“We got lucky,” Fajar said, from across the desk.
Asep studied the chart. The spike was modest enough that it wouldn’t have triggered any alerts — it wasn’t a sudden dramatic jump. It was the kind of change that looked like normal variation on any given day, but over weeks added up to something significant.
“What changed four weeks ago?” he said.
No one answered immediately. They all started checking deployment logs, change records, anything that might correspond to that window.
Dito, without being asked, had pulled up the Kubernetes deployment history and was scrolling through it with more focus than he typically applied to assigned tasks.
“There was a deployment to the logistics module,” he said. “About 29 days ago.”
The Phone Call
Asep was deep in the logistics module configuration when his phone buzzed.
Ayah, can you take a call?
He almost didn’t pick up. He was close to something — he could feel the shape of it just out of reach — and interruptions at this stage had a way of breaking whatever thread he was holding. But it was his daughter, and it was past seven, and he had made himself a promise about that years ago.
“Hey. What is it?”
Her voice had the bright, slightly exasperated tone she used when she had solved a problem herself and wanted credit for both the finding and the fixing.
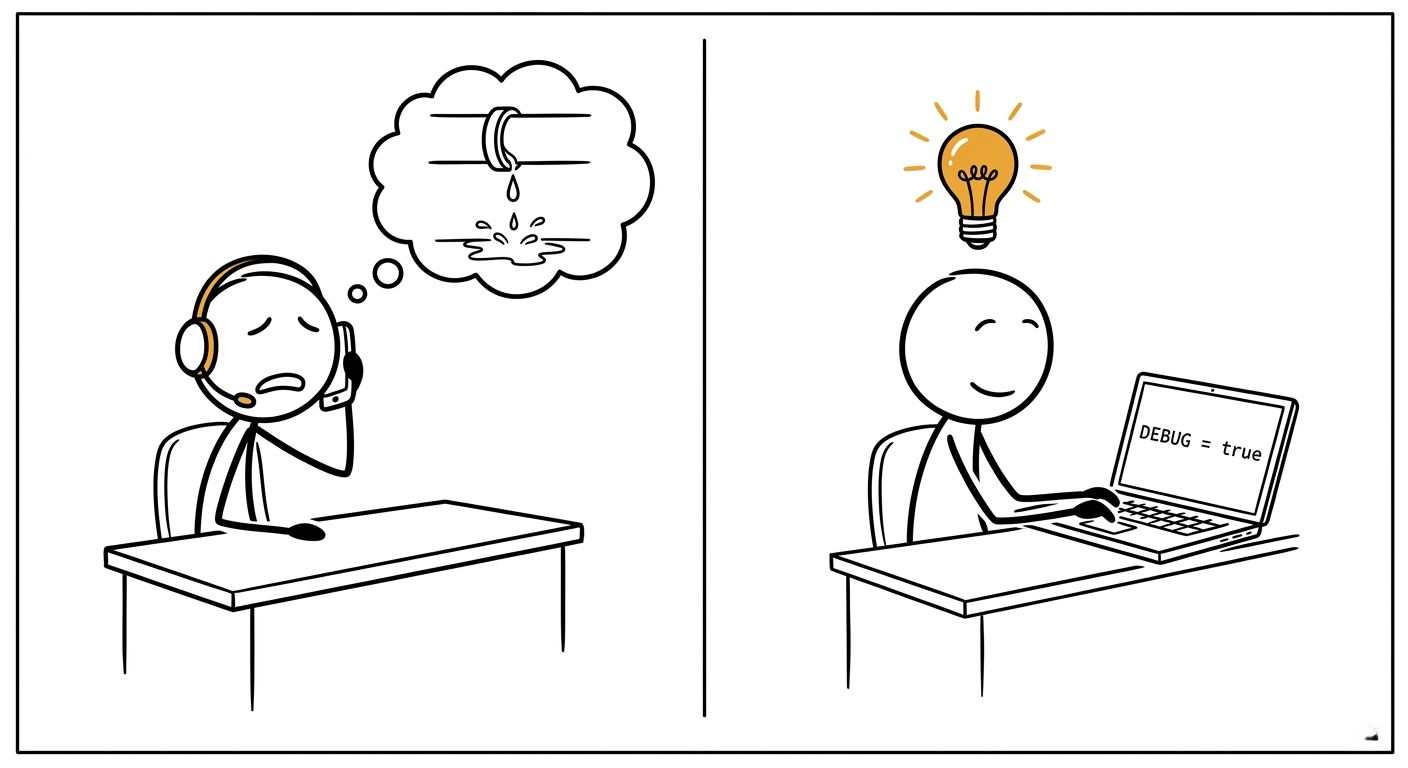
“Dad, I’ve been trying to figure out why the water bill keeps going up. The garden tap barely runs — seemed normal. But I found a small leak in a pipe on the side of the house. Must have been dripping for a while. Nothing dramatic, just — constantly losing water, in a place nobody thought to check.”
Asep stopped.
A small, steady leak. Not visible from the obvious places. Running continuously because no one had looked at the pipe itself — only at the tap.
“You just helped me solve something at the office,” he said.
A pause. “…Okay. You’re welcome, I think. Does that mean the pipe is going to get fixed?”
“Yes. And thank you. Seriously.”
He hung up and opened the logistics module deployment notes.
It took four minutes.
The Source
Debug logging had been enabled in the production environment.
Not for a critical service. Not as a deliberate decision. During the deployment four weeks ago, a developer had enabled verbose debug output to trace a specific performance issue in the logistics module — a Kubernetes-hosted service that handled internal routing calculations. The issue had been identified and resolved. The debug flag had never been turned off.
For four weeks, the service had been generating detailed internal state logs: variable values, execution paths, intermediate calculation results. Thousands of lines per minute. All of it indexed, retained, and stored by the platform.
None of it had been queried since the original troubleshooting session.
Fajar pulled up the volume contribution. “This accounts for roughly 28% of the cluster’s ingestion increase.”
“Not the whole answer,” Asep said. “But a real one.”
He thought about the metrics chart Dita had found — the slow, steady climb that had been visible only because they happened to look within the 30-day retention window. If they had caught this a week later, that trail would have been gone. They would have been diagnosing a cost problem without being able to see when it had started.
“We were lucky,” he said. “Thirty days of metrics visibility, and we caught it with a week to spare.”
“Should we thank the retention policy?” Dito asked.
“No,” Asep said. “We should fix the retention policy. Thirty days is not enough to catch this kind of drift reliably.” He paused. “But yes, also — today, we were lucky.”
One Answer, Many Questions
They stayed another hour. With the pisang goreng long finished and the coffee cooling, the team documented what they had found:
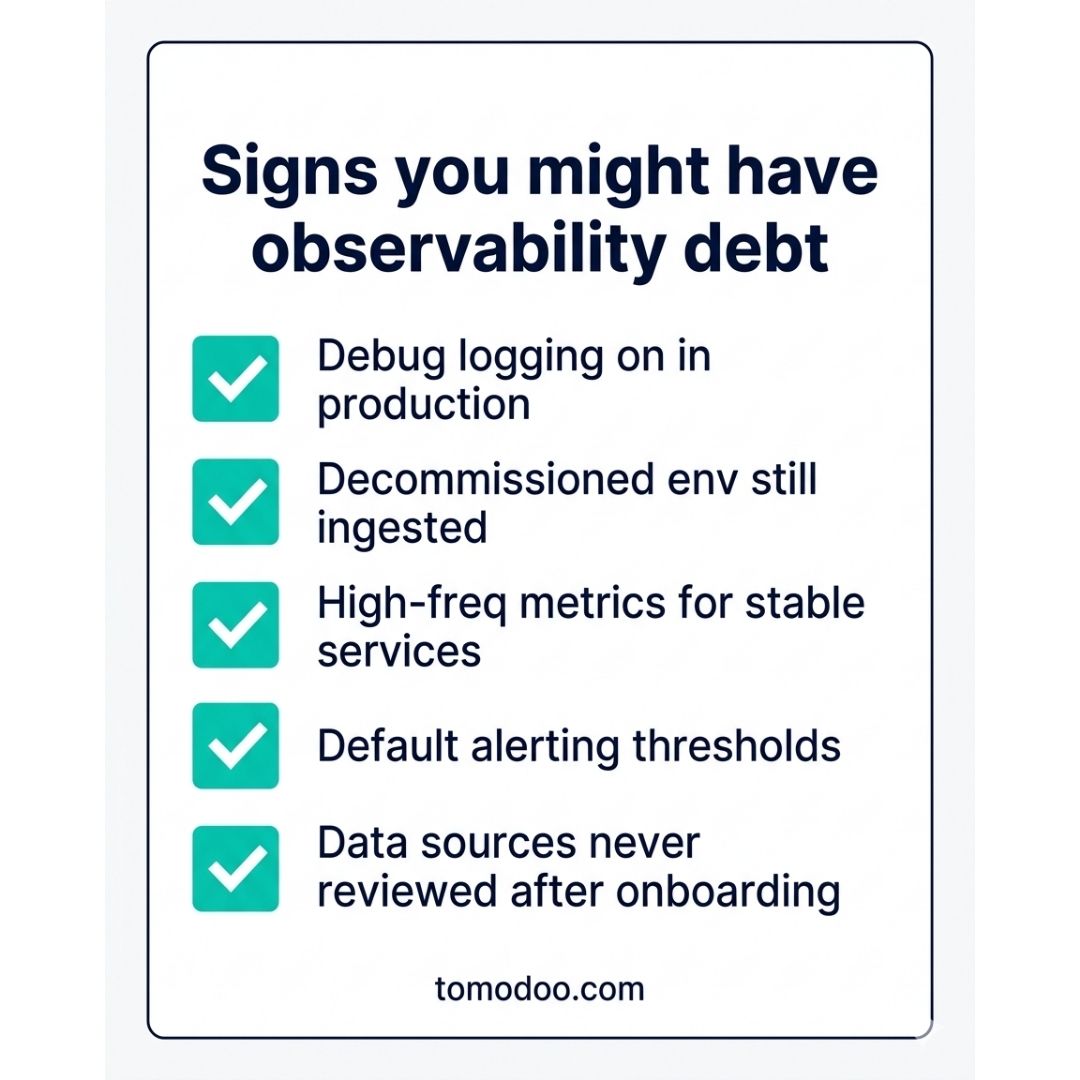
- Debug logging enabled in a production K8s service, generating noise for four weeks
- A staging environment still being ingested into the production platform after its project had concluded
- High-frequency metric collection on several services with no incidents in months
- Alerting rules running on default thresholds that no one had intentionally configured
Each item was individually small. Together, they were starting to explain the number on the slide.
“Is this everything?” Dita asked.
“No,” Asep said. “This is the part we can see. There’s more we haven’t found yet.” He looked at the notes on his screen. “The question isn’t just ‘what did we find.’ The question is: how did we get here without anyone noticing?”
He added a line to his document:
We have been optimizing for collection. We should have been optimizing for value.
What This Means
A debug flag left on after a troubleshooting session ends is one instance of a broader pattern: data that was useful in one context, generating cost in another.
It is not a mistake born from negligence. It is a mistake born from momentum. The session ends. The flag stays on. The platform keeps ingesting. Nobody turns it off because the work is done — and nobody thinks to check because the service is running fine.
This pattern repeats at every layer:
- Log messages from healthy systems narrating events no one ever searches for
- Metrics sampled at high frequency for services that only need minute-level visibility
- Traces captured in full detail for stable code paths that haven’t changed in months
- Data sources running on default settings long after their original purpose has passed
The data is there. It just isn’t meaningful. And the gap between “data we have” and “data that helps us” has a cost — in storage, compute, platform fees, and the hours spent searching for signal inside noise.
The field calls this accumulation observability debt. It builds quietly. It compounds. It shows up, eventually, as a number on a slide that nobody can immediately explain.
Kartana Corp had it. Asep now had a clearer picture of where some of it was hiding — and a growing sense of how much more there was to find.
Up Next
In Episode 2: “What Does Your Observability Actually Cost?”, we build the full picture — a real total cost of ownership that goes beyond the platform invoice. Before you can fix the problem, you need to see all of it.
The Observability Cost Crisis is a narrative series by Tomodoo. The characters and company are fictional. The problems are not.
Recognize your own environment in this story? Let’s talk.