This is Episode 2A of The Observability Cost Crisis — a series following one engineering team through the hidden costs of modern observability. If you’re just joining, start with Episode 1A.
Three Days Later
The director had given Asep two weeks.
That was the good news. The bad news was that three days in, the problem had already grown twice as large as it looked in the meeting room.
It wasn’t that the data was wrong. The 43% increase was real. It was that the more Fajar dug, the more he kept finding costs that weren’t in the original number — costs that lived in different budget lines, got attributed to different teams, and had never been looked at together in the same room at the same time.
On Thursday afternoon, Fajar pulled up a dashboard on the conference room screen.
“I’ve been adding things up,” he said.
Asep looked at the numbers. Then he looked at them again.
“That’s not just the license,” he said.
“No,” Fajar said. “It’s not.”
What The Invoice Doesn’t Show
Most conversations about observability costs start and end with one number: the platform bill. The invoice that arrives monthly or quarterly, gets highlighted in budget reviews, and ends up on a slide with a percentage next to it.
That number is real. But in almost every organization, it’s the most visible slice of a much larger picture.
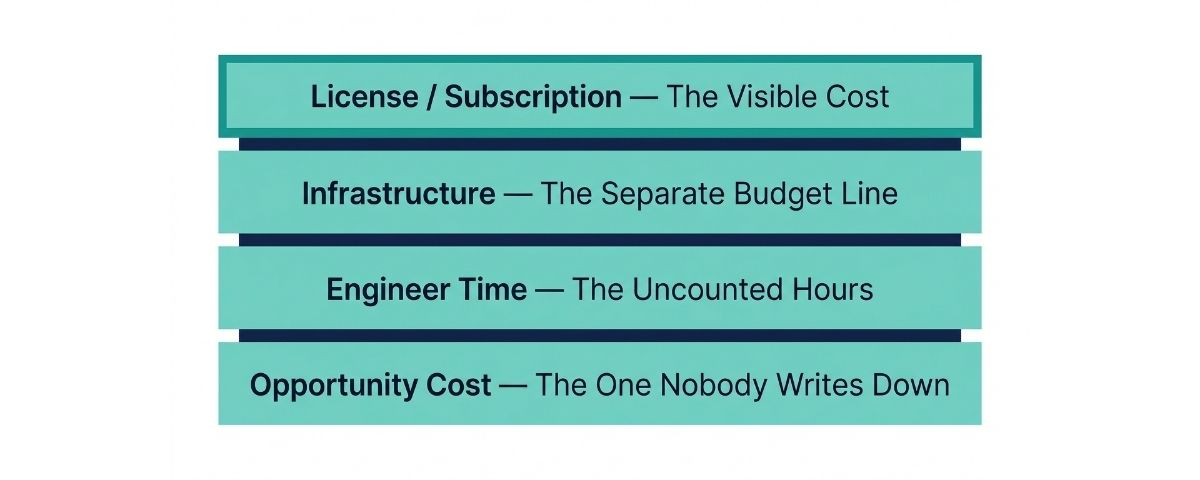
The full cost of running observability has at least four layers:
License or subscription is what you pay the vendor directly — or what you pay a cloud provider for a managed service. This is the number that appears on the invoice. It’s the one that gets discussed in director meetings. It feels like the whole cost because it’s the only one with a dedicated line item.
Infrastructure is what you pay to run the platform. If you’re on a self-hosted setup, this means servers, storage, and compute — often provisioned separately under an infrastructure budget that never sits next to the observability invoice. A platform processing significant log volumes needs real hardware. When that hardware gets upgraded or expanded, the cost doesn’t show up as an observability expense. It shows up as a server purchase, or a storage expansion, or a cloud compute line item in a completely different report.
Engineer time is the cost that almost never gets calculated, and almost always turns out to be the largest. Setting up the platform. Writing and maintaining pipelines. Building dashboards. Tuning alert thresholds. Onboarding new log sources. Investigating unexplained ingestion spikes. Upgrading platform versions. Responding to the 11pm Friday alert that turns out to be a configuration drift. None of this appears on any invoice. It appears on a calendar, and then quietly disappears.
Opportunity cost is the one no one ever writes down. Every hour an engineer spends maintaining observability infrastructure is an hour they aren’t spending on something that moves the business forward. It’s almost impossible to quantify — which is precisely why it almost never enters a budget conversation. It should.
Fajar had estimated all four. The total was not a comfortable number.
“So we’ve been underreporting the actual cost of this platform for years,” Dita said, looking at the dashboard.
“Not underreporting,” Asep said. “Undercounting. The costs were real. They were just scattered across different places where nobody was looking at them together.”
That, as it turned out, was its own kind of problem.
The Proposal
It was Fajar who said it first — which surprised everyone, including Fajar.
“What if we migrate to ELK?”
Dito stopped typing. Dita looked up from her notebook. Asep put down his coffee.
Fajar continued, with the energy of someone who had been thinking about this longer than the meeting had been running. “ELK is open-source. No license cost. Elasticsearch, Logstash, Kibana — each component is mature, widely adopted, massive community. Elasticsearch is arguably better than any proprietary platform at full-text search at scale. Kibana has caught up significantly on dashboarding. And we control everything — retention, scaling, architecture. Nobody surprises us with a 43% increase because we changed ingestion volume.”
It was, Asep reflected, a genuinely good argument. Fajar had done his homework.
Dita leaned forward. “The query language, the pipelines, the dashboards we’ve built — all of that would need to be rebuilt from scratch?”
“Yes,” Fajar said, without hesitation. “Full migration. Nothing carries over cleanly.”
A brief silence.
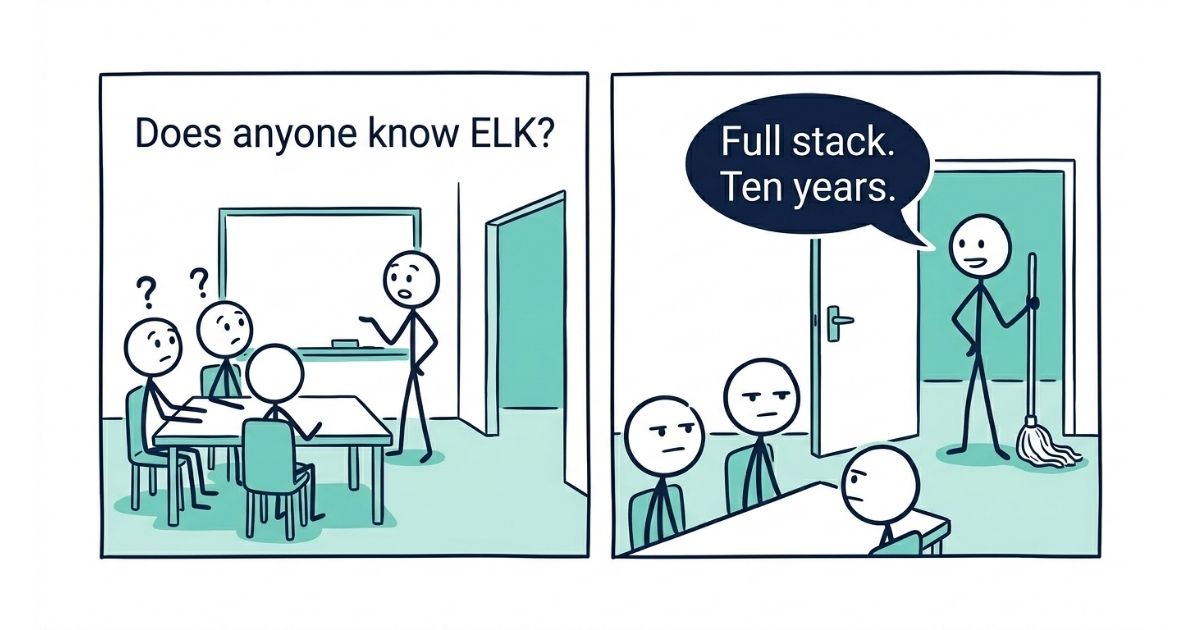
Dito raised his hand. “Does anyone on our team actually know ELK?”
“I have some experience,” Fajar said.
“Enough to run it in production? For a company this size?”
A slightly longer pause. “…Enough to get started.”
A voice came from the doorway.
“I know ELK.”
Everyone turned.
Ardi, the office cleaning staff, was standing at the door with a mop in one hand and a trash bag in the other. He had the calm, unhurried expression of someone who had simply answered a question that happened to be asked near him.
“Ardi?” Asep said carefully. “You know ELK?”
“Almost every day,” Ardi said.
The room was quiet. Fajar looked at Dita. Dita looked at her notebook.
Dito, who always asked the question no one else would, leaned forward. “…How long?”
Ardi thought about it for a moment. “Almost ten years now. ELK, Ember, Lap, Kemoceng.” He held up the mop slightly, by way of illustration. “Full stack.”
A long silence.
“Thank you, Ardi,” Asep said.
“No problem, Pak.” Ardi nodded pleasantly and continued down the hallway.
Fajar stared at the empty doorway for a moment. “I walked into that.”
“We all did,” Dita said.
Dito was already writing something in his notes. When Asep glanced over, it said: ELK expertise — ask Ardi.
In Episode 2B — “There Is No Free Lunch”, Asep walks to the whiteboard and does the math nobody wants to do — what it would actually cost to change platforms, and why the real question isn’t which tool you use. It’s whether you’re getting value from the one you have.