Previously: Asep walked the team through the full migration scope on the whiteboard. Schema on read, schema on write. Dito fell asleep and woke up to give a surprisingly accurate recap. And Dita — quietly, in her notebook — wrote down a question nobody had answered yet: why were debug logs flowing from Kubernetes into the indexers with no filtering at the Heavy Forwarder level?
The whiteboard was still full.
Asep had left the migration scope diagram up from the day before — not because it was unfinished, but because erasing it felt premature. Fajar had photographed it three times on his phone. Dita had transcribed the key parts into her notebook, neat columns, dated header.
Dito had arrived early and was staring at it like it owed him money.
“I’ve been thinking,” he said, without turning around.
“Dangerous,” said Fajar, not looking up from his laptop.
“No, seriously.” Dito pointed at the bottom-left corner of the whiteboard — the section Asep had labeled Sources. “We keep talking about what’s expensive. But we never asked: what’s actually supposed to be there?”
Nobody answered immediately. Not because the question was bad. Because it was too good, and it had arrived unannounced.
Dita looked up from her notebook.
Asep, who had been refilling his coffee, stopped in the doorway.
“Say that again,” Asep said.
“I mean—” Dito turned around, slightly alarmed at being taken seriously. “We know logs are expensive. We know some logs shouldn’t be there. But what should be there? Does anyone have a list?”
Silence.
Fajar closed his laptop halfway. “That’s… actually the question, isn’t it.”
The Problem With “All Logs”
It sounds obvious in retrospect. Before you can audit what you have, you need a definition of what you’re supposed to have. Before you can say this log is unnecessary, you need a framework that explains what necessary means.
Asep put his coffee down and picked up a marker.
“Let’s start here,” he said. “What is a log, actually?”
“A record of something that happened,” Dita said immediately.
“Right. And why do we keep records of things that happened?”
The team thought about this longer than expected.
“So we know what went wrong,” said Fajar.
“So we know the system is working,” said Dita.
“So we can blame someone,” said Dito.
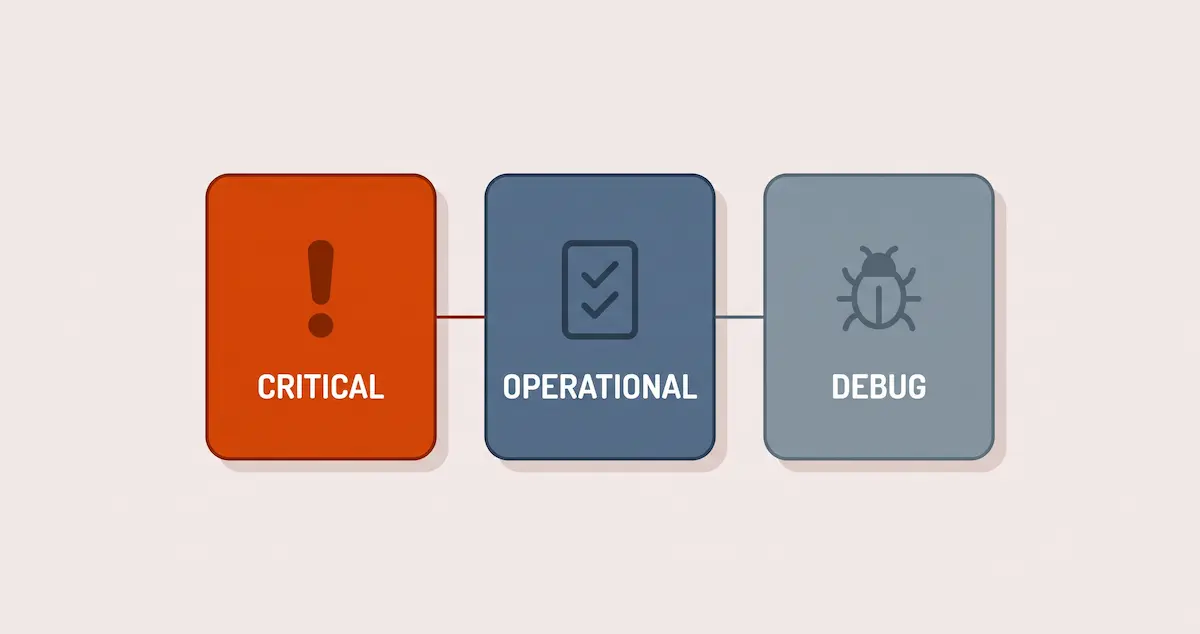
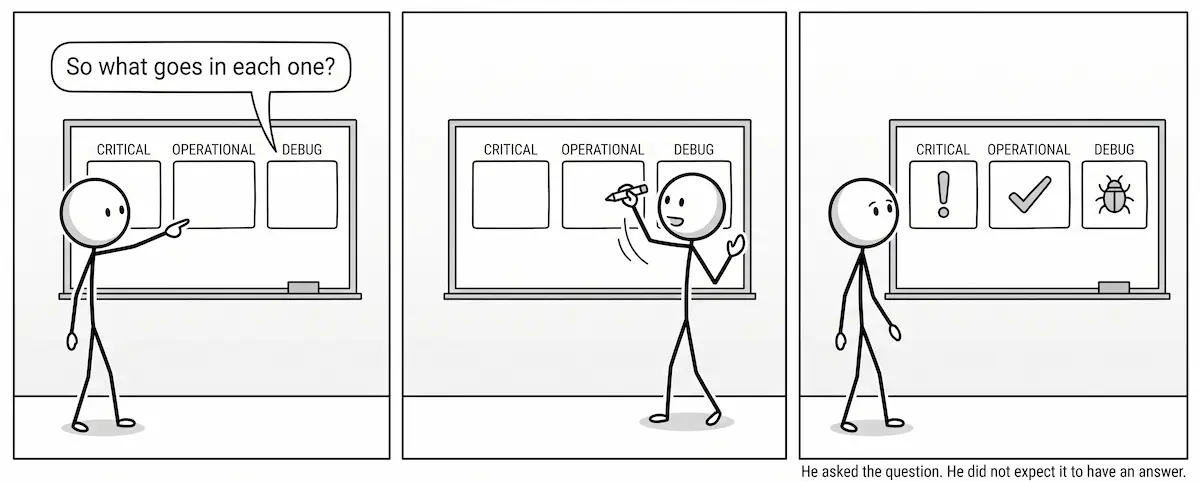
Asep wrote three columns on a new section of the whiteboard.
Critical. Operational. Debug.
Three Kinds of Logs, Three Kinds of Value
The classification isn’t new. It shows up in different forms across different literature — Michael Hausenblas and Tibo Beijen formalize it in Logging in Action, and it holds up in practice because it maps to three genuinely different questions you’re trying to answer.
Asep worked through each one.
Critical logs are the ones that tell you something went wrong — or was about to. Error events. Security alerts. Audit trails. These are the logs you need to have. They’re what you reach for at 2 AM when an alert fires and you need to understand what happened. They’re also, often, the logs with compliance implications — you may be legally required to retain them.
When a payment fails, that’s a critical log. When authentication is rejected, that’s a critical log. When a service crashes, the stack trace is a critical log.
The cost is worth it. These logs earn their place.
Operational logs are quieter. Startup events. Configuration changes. Scheduled jobs completing. Health checks. These logs don’t tell you anything is broken — they tell you the system is behaving the way it should. You need them for behavioral baselines. When something does go wrong, operational logs help you understand the before.
A service starting up: operational. A configuration reload completing: operational. A backup job finishing at 3 AM: operational.
They’re valuable, but they’re also numerous — and how long you need to keep them is a genuinely different question than how long you keep critical logs.
Debug logs are the most misunderstood of the three. They aren’t inherently bad. They were never supposed to be bad. Debug logs are the detailed internal monologue of a running application — what functions were called, what values were passed, what paths were taken. They’re what developers need during active investigation. They’re gold during a debugging session.
The problem isn’t debug logs. The problem is debug logs in production, at full verbosity, flowing continuously into an indexer that bills by volume, with no expiry and no stated purpose.
Fajar had been quiet for a while. “So the question isn’t whether debug logs are bad.”
“The question is why they’re still on,” Dita said, finishing the thought.
The Default Is Everything
There’s a moment in almost every log audit where someone realizes the uncomfortable truth: nobody decided.
Not in the way decisions usually get made — with intent, with tradeoffs, with review. The logs are there because the default was to send everything, and nobody had a reason to change the default, and nobody was measuring the consequence of not changing it, and the bill kept growing in a line item that wasn’t anyone’s primary responsibility.
It’s not negligence. It’s the natural physics of systems built to work first and be optimized later, in organizations where “later” kept getting pushed.
Dita flipped back two pages in her notebook. “I wrote this down in the last session,” she said. “Kubernetes workloads. OTel Collector DaemonSet on each node. Everything goes to the Heavy Forwarder, then to the indexer. No filtering at the HF level.”
“Still true,” said Fajar.
“So debug logs from every container, on every node, at whatever verbosity the developers set—”
“Going straight in,” Fajar confirmed. “Unfiltered.”
Dita nodded and wrote something down.
Dita Goes Looking
A framework is only useful if you apply it to something.
Dita picked one service to start with — not the largest, not the loudest. She picked the one whose volume had been growing steadily for months without ever spiking hard enough to trigger anything. A line that went up and to the right, patiently, for long enough that it had become the shape everyone expected.
To classify its logs, she needed to know what its events actually looked like. So she pulled a sample.
The first few were unremarkable. Transaction accepted. Transaction routed. Transaction completed. Standard fields — timestamp, transaction ID, status code, amount, a description field.
She scrolled.
The description field on one event did not end where she expected it to. It kept going. Then it kept going some more.
Inside it: the full transaction description, written to stdout exactly as it was stored — including the formatting. Paragraph tags. Line break tags. Span tags carrying inline styles. Somewhere in the middle, an unclosed element that had clearly survived a copy-paste from a rich text editor years ago and been faithfully carried forward ever since.
None of it was searchable in any way that mattered. None of it would ever be used in a dashboard, an alert, or an investigation. It was presentation markup for a screen that no engineer would ever look at.
Dita read it twice, then checked another event.
That one was normal.
She checked ten more. Eight were normal. Two were not.
That was the part that stopped her.
If every event had looked like that, someone would have caught it. A source that consistently generates oversized events shows up eventually — in a volume report, in a license usage dashboard, in a daily average that stops looking like the daily averages around it.
But this wasn’t consistent. Most transactions carried short descriptions or none at all. Only some carried the long ones — and those didn’t arrive evenly. They clustered. Quiet for stretches, then a run of them together, then quiet again.
Averaged across a day, it disappeared into the noise. Averaged across a month, it looked like ordinary growth.
Dita sat back.
She didn’t know how much data this was. She didn’t know how often the clusters happened, or what triggered them, or whether this was one service doing it or the pattern of an entire application framework nobody had reviewed.
What she knew was that she had found it by accident, while looking for something else, on the first service she happened to check.
She wrote it down. Then she underlined it.
Then, after a moment, she added a second line beneath it:
What else looks normal on average?
The Questions You Haven’t Asked Yet
Here’s the thing about defaults: they compound.
Kubernetes debug logs are the obvious case. They’re visible because they’re recent, because Fajar flagged the volume anomaly, because the arc of this whole conversation started with a number on a slide that was 43% too large.
But Kubernetes isn’t the only source. And, as Dita had just demonstrated, the obvious cases are only the ones loud enough to be obvious.
Fajar said it first: “What about the Universal Forwarders?”
Eight thousand of them. Deployed across the on-premises environment, across managed endpoints, across servers that had been running long before the current team was assembled.
“What are they actually sending?” Dita asked.
Nobody knew the precise answer. That was the problem.
Every Linux server has a /var/log/messages. It captures kernel events, system
daemon output, authentication events, hardware errors — a mix of things ranging
from genuinely critical to completely irrelevant. On a healthy, quiet server, it
generates noise. On eight thousand servers, that noise is continuous.
Then there are the monitoring agents. Every node with a forwarder likely also has an agent sending heartbeat events — small, regular, just-checking-in signals that prove the agent is alive. Necessary for availability monitoring. But at what retention? At what volume? Across eight thousand endpoints?
And cron jobs. Every server runs scheduled tasks. Every scheduled task writes a log line. Every log line goes somewhere.
None of these are malicious. None of them are the result of bad decisions. They’re the result of no decision — which, at scale, produces the same outcome.
Asep had been listening without writing anything down. Now he uncapped his marker and added one more line to the whiteboard, under the header he’d been building toward all morning:
What else is default?
Framework Before Audit
The team left that session with something they hadn’t had before: a shared vocabulary.
It sounds small. It isn’t.
In an environment with multiple teams, multiple platforms, and years of accumulated configuration decisions, the word “log” can mean twenty different things to twenty different people. When someone says “we should cut logging costs,” one person hears remove the debug output from the new microservices, another hears reduce retention across the board, and another hears we’re going to delete something important and it’s going to be my fault when the audit happens.
The framework doesn’t solve that. But it creates a shared reference point.
Critical means: you are not allowed to remove this without a documented justification reviewed by the right people.
Operational means: evaluate retention independently from critical logs. Ask how long you actually need behavioral baselines before they stop being useful.
Debug means: justify the presence of this in production. Who is reading it? What question does it answer? If the answer is “nobody” and “nothing currently” — that’s your first candidate.
And then there’s the fourth category, the one that doesn’t appear on any whiteboard because nobody thinks to draw it: data that was never meant to be a log at all. Fields that exist for one system, written into a stream consumed by another, carried along because the code that wrote them was never asked why.
Dita had written all of this down. She would use it later.
Before You Audit, You Need a Map
The honest admission at this stage: Kartana Corp doesn’t yet know what they have.
They know there’s a Kubernetes volume anomaly. They know debug logs are flowing unfiltered from the cloud cluster. They know there are eight thousand forwarders with undocumented configurations and unknown send rates. And they know that one service — checked almost at random — is quietly shipping presentation markup into a system that charges by the gigabyte.
What they’ve built in this session is the lens they’ll use to look at all of it.
Classification isn’t the answer. It’s the prerequisite to finding the answer.
Next: actually look.
Next episode: Fajar runs the numbers on what Dita found. Her notebook becomes a working document. And the team finally looks — properly — at what eight thousand forwarders have been sending this whole time.
The Observability Cost Crisis is a narrative series by Tomodoo. The characters and company are fictional. The problems are not. The /var/log/messages entries are, frankly, universal.
Recognize your own environment in this story? Let’s talk.