This is Episode 1 of The Observability Cost Crisis — a series following one engineering team through the hidden costs of modern observability. Each episode combines story, theory, and practical insight.
The Monday Nobody Wanted
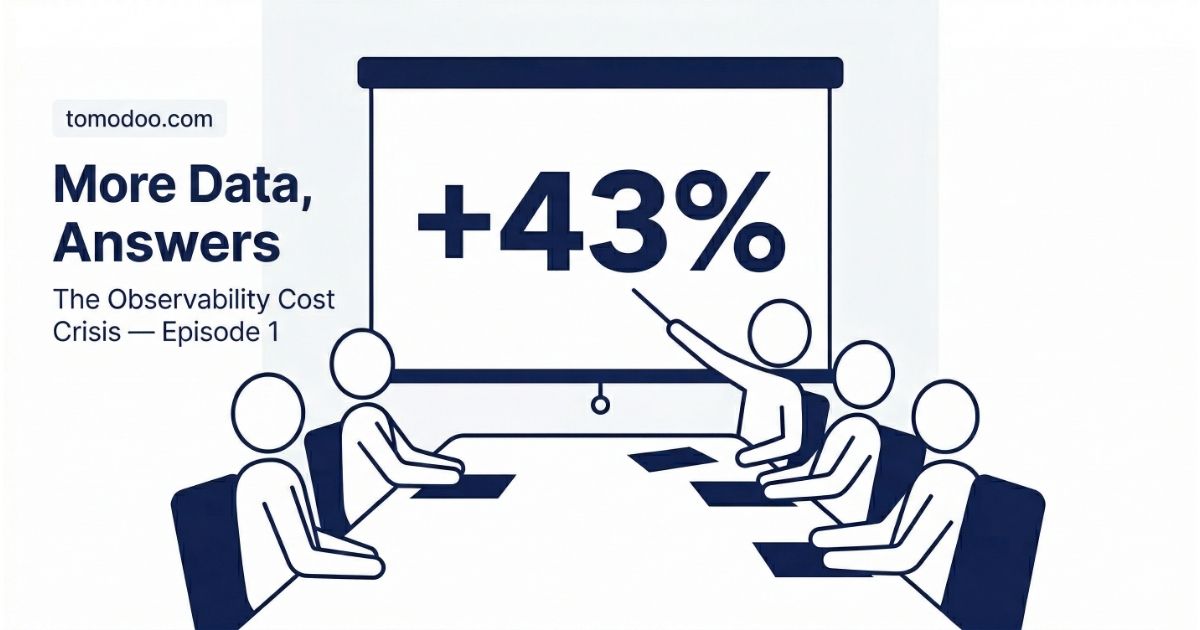
The slide had exactly one number on it: +43%.
That was how much Kartana Corp’s observability platform costs had grown in a single quarter. Asep stared at it from across the meeting room table, doing the mental arithmetic he already knew the answer to.
The director’s voice was calm. Which was somehow worse than if she had been angry.
“Asep. Can you explain this?”
Twenty-three years in infrastructure, network, security, and observability. He had migrated data centers, survived audit seasons, and once kept a core banking system running during a flood using a conference room WiFi router. He was not a man who was easily rattled.
“I’ll look into it,” he said.
His professional way of saying: I have absolutely no idea.
What the Platform Was Actually Doing
Every system at Kartana produced data continuously. Web servers recorded every request. Linux servers recorded system events. Applications recorded transactions, errors, and internal states. Network devices recorded traffic flows. Kubernetes clusters running the newer microservices recorded container health, pod restarts, and resource consumption.
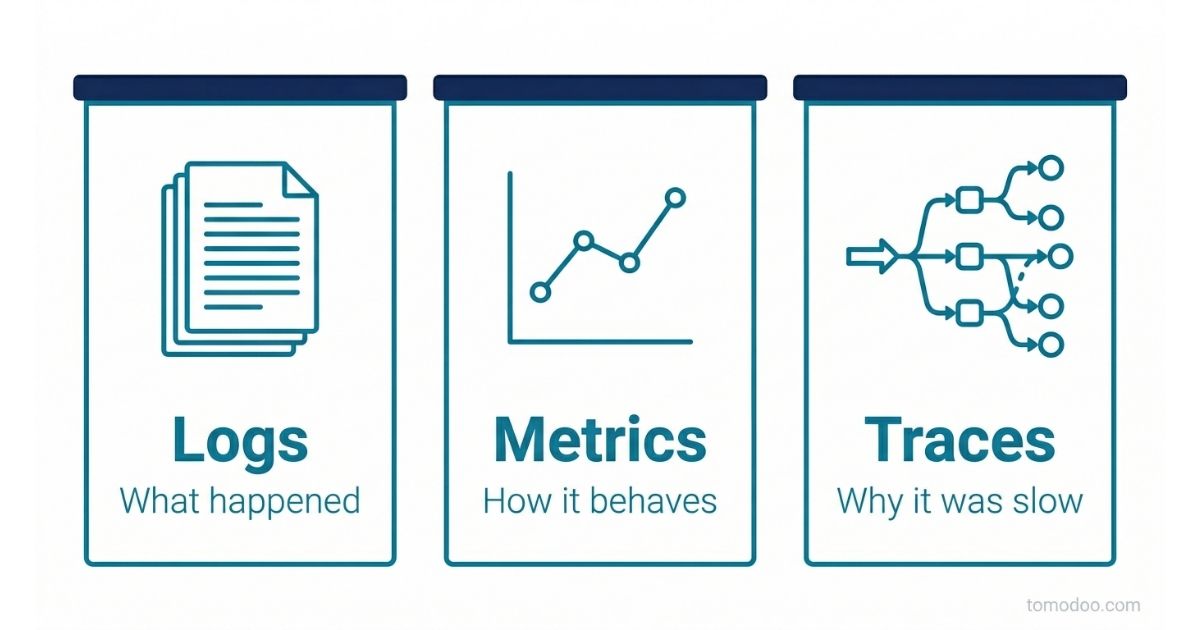
Modern observability platforms ingest all of this in three forms:
- Logs — text records of discrete events. “Payment service returned 500 at 14:32.” “Pod restarted unexpectedly.”
- Metrics — numerical measurements over time. CPU at 78%. Error rate at 0.3%. 342 requests per second.
- Traces — the journey of a single request across multiple services, showing exactly where time was spent and where things broke.
Each tells a different part of the story. Together, they give you — in theory — full visibility into everything.
The word everything was doing a lot of work in that sentence.
Back at the Desk
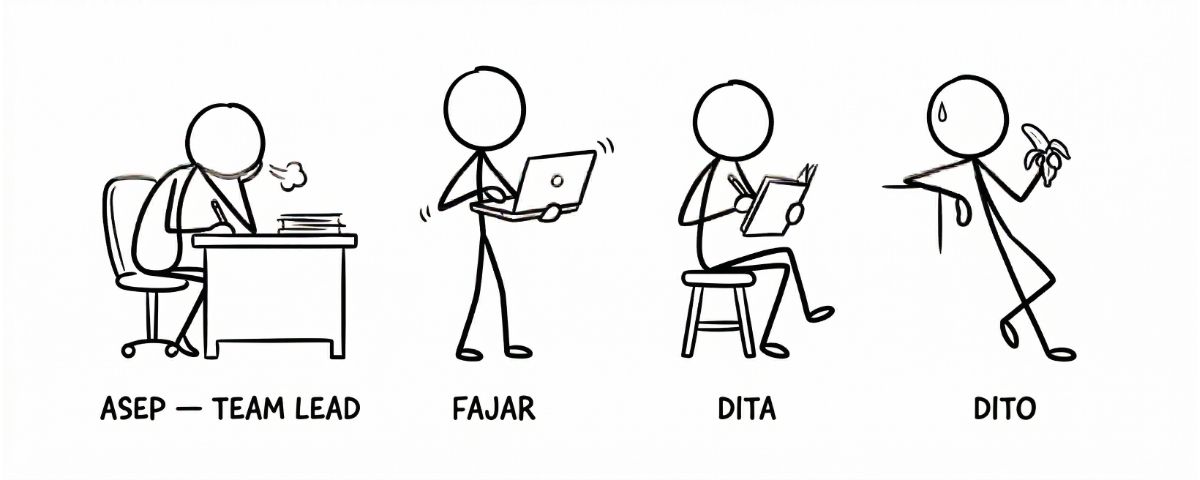
The office floor was open — rows of desks, monitors, and the low ambient noise of a team that had learned to concentrate in proximity to each other. Asep dropped his bag on his desk and looked at his team.
Fajar, three months into the job, was already pulling up dashboards with the careful focus of someone who had inherited a system and was still mapping its edges. Dita had her notebook open, pen ready. Dito was finishing a banana and appeared to be thinking about something entirely unrelated to the situation.
“We have a cost problem,” Asep said. “I need everyone pulling data.”
“I’ve been looking at ingestion volumes since last week,” Fajar said. “The Kubernetes cluster is generating roughly the same volume as the entire on-premises environment. That doesn’t feel right for how small those services actually are.”
Asep frowned. It didn’t feel right to him either.
“Good catch,” Asep said. “Keep digging on that.”
Fajar nodded and turned back to his screen.
“Dita, pull the source breakdown for the last 90 days — volume and query frequency side by side.”
“On it,” she said.
He turned to Dito. “Check whether anyone has reviewed the alerting rules for the new services since they went to production.”
Dito nodded with the expression of someone who had been expecting exactly this assignment.
He had not been expecting this assignment.
The Bill Behind the Bill
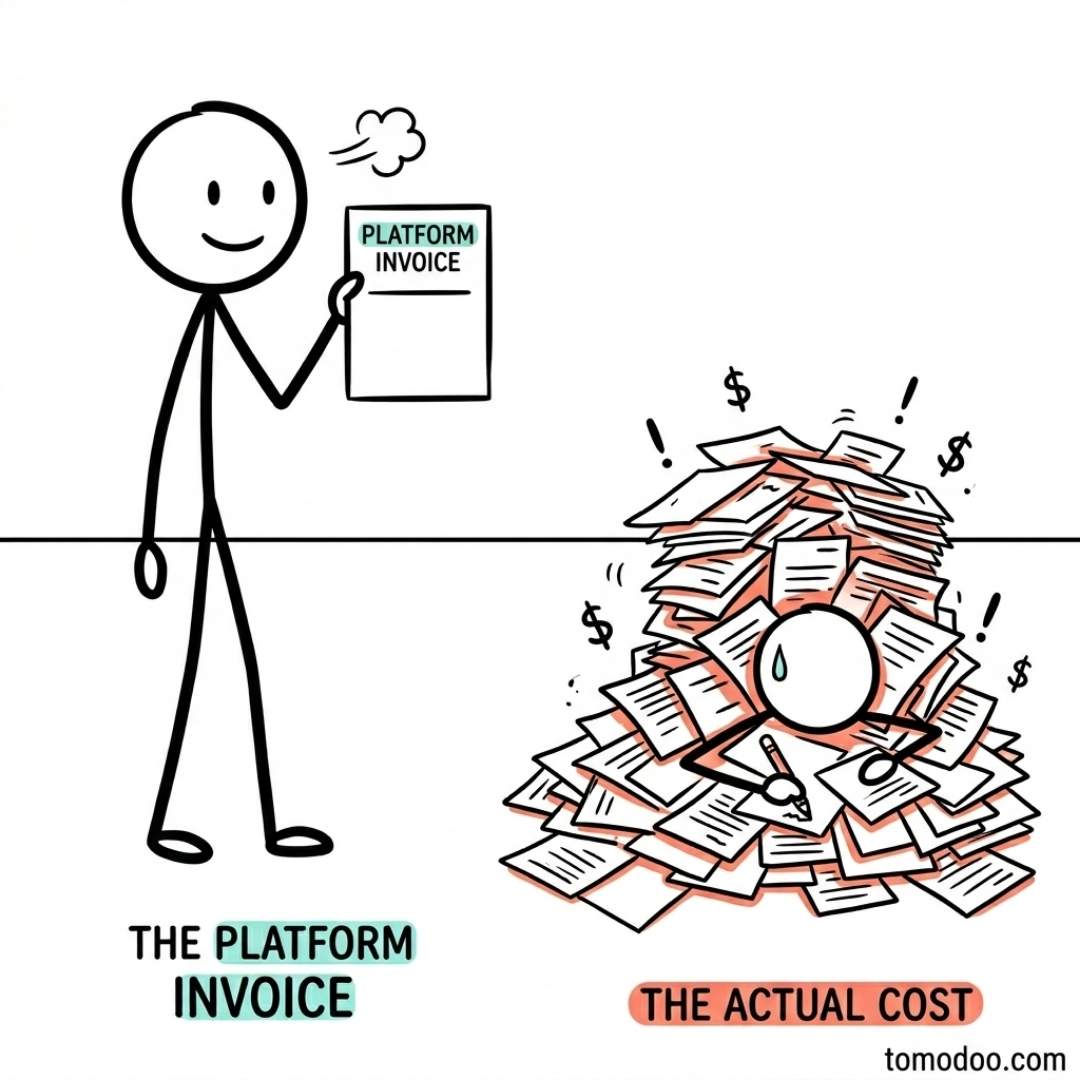
By afternoon, it was clear the platform invoice was only part of the story.
Fajar had built a cost breakdown that went further. The observability platform charged based on ingestion volume — but that wasn’t the only place the cost was appearing.
Storage. Every log event, every metric point, every trace had to be kept somewhere. On-premises storage budgeted to last two more years was now projected to fill in eight months. A hardware refresh that hadn’t been planned was quietly becoming necessary.
Compute. Indexing and processing all that data required CPU and memory. The platform’s own infrastructure was running consistently above comfortable thresholds. Scaling it meant either new hardware or more cloud workload — both with their own cost implications.
People. This one didn’t appear on any invoice. Asep had spent two hours in a meeting about a problem he couldn’t explain. His team was spending the afternoon diagnosing something that shouldn’t have grown this large. Every hour here was an hour not spent elsewhere.
“So it’s not really 43%,” Dita said, looking at the spreadsheet.
“No,” Asep said. “The invoice just shows the part that has a line item.”
Nobody said anything for a moment.
Then Dito appeared from behind his monitor, jacket already on, bag over his shoulder. He had the look of someone who had been building up to saying something for the past ten minutes.
“I need to head out early,” he said. “My mother has to be picked up from the hospital. Routine therapy visit. I’m really sorry.”
Asep looked at him. Then at the screen. Then back at him.
“Is the stroke recovery still ongoing?”
“Still going,” Dito said, “but she’s more stable now. The doctors say she’s responding well.”
“Good.” Asep paused. “Go. But come back after.”
Dito’s expression briefly suggested this outcome had not been part of his original plan. But he recovered quickly.
“Of course. Should I bring anything back?”
“Coffee,” Asep said. “And pisang goreng if there’s still any.”
“I’ll need some cash. End of the month, you know how it is.” Dito grinned.
Asep reached for his wallet, counted out enough for the coffee and snacks, then added more.
“The extra is for dragon fruit,” Asep said. “Bring some for your mother. And give her my regards — I hope she gets well soon.”
Dito looked at the money in his hand. For just a moment, something in his expression shifted — the easy grin replaced by something quieter and more genuine.
“Thank you, Pak Asep.”
“Go,” Asep said, already looking back at his screen.
More Than a Source Problem
By early evening, Dita’s breakdown was ready. Several sources hadn’t been queried in over 90 days, yet were still being ingested daily. Real findings, worth acting on. But Asep kept looking past them.
Fajar had noticed. “You think it’s something else?”
“I think it’s also something else,” Asep said. “The inactive sources explain some of it. But the numbers still don’t fully add up.”
This is the pattern that repeats in teams everywhere: the assumption that collecting more means knowing more. A new service gets onboarded — logs, metrics, traces, all of it, by default. A configuration decision made during a troubleshooting session never gets revisited. An integration pulls in data that felt important once and has never been questioned since.
The data is there. It just isn’t meaningful. And the gap between “data we have” and “data that helps us” has a cost — in storage, in compute, in the invoice, and in the hours spent searching for a signal buried in noise.
The field calls this observability debt. Like technical debt, it builds quietly, feels manageable until it doesn’t, and is always harder to fix than it was to prevent.
Kartana had it. How much, Asep didn’t yet know.
The answer was coming. It would arrive — unexpectedly — with a phone call.
In Episode 1B: “The Leak Nobody Saw”, Asep stays late, Dito returns with coffee that is still, somehow, hot, and a conversation with his daughter points to the source that everyone had looked at but no one had actually questioned.
The Observability Cost Crisis is a narrative series by Tomodoo. The characters and company are fictional. The problems are not.